

Vibe Landing Page Arena: 36,000 Human Judgments on Which AI Tool Builds the Best Landing Pages
April 7, 2026

Every AI code generation tool claims it can build you a website in minutes. We tested that claim with 36,000 human judgments.
We gave Claude Code, Cursor, Lovable, and Replit the same 100 detailed landing page prompts spanning 97 business categories, from SaaS to skincare to legal tech, and had 3,492 people judge the results across four design dimensions. This is the largest controlled evaluation of AI-generated web design published to date.
The data was collected on Datapoint, where every comparison was served as a side-by-side pairwise task with randomized display positions and 15 independent judgments per matchup per dimension. No tool labels were shown to evaluators.
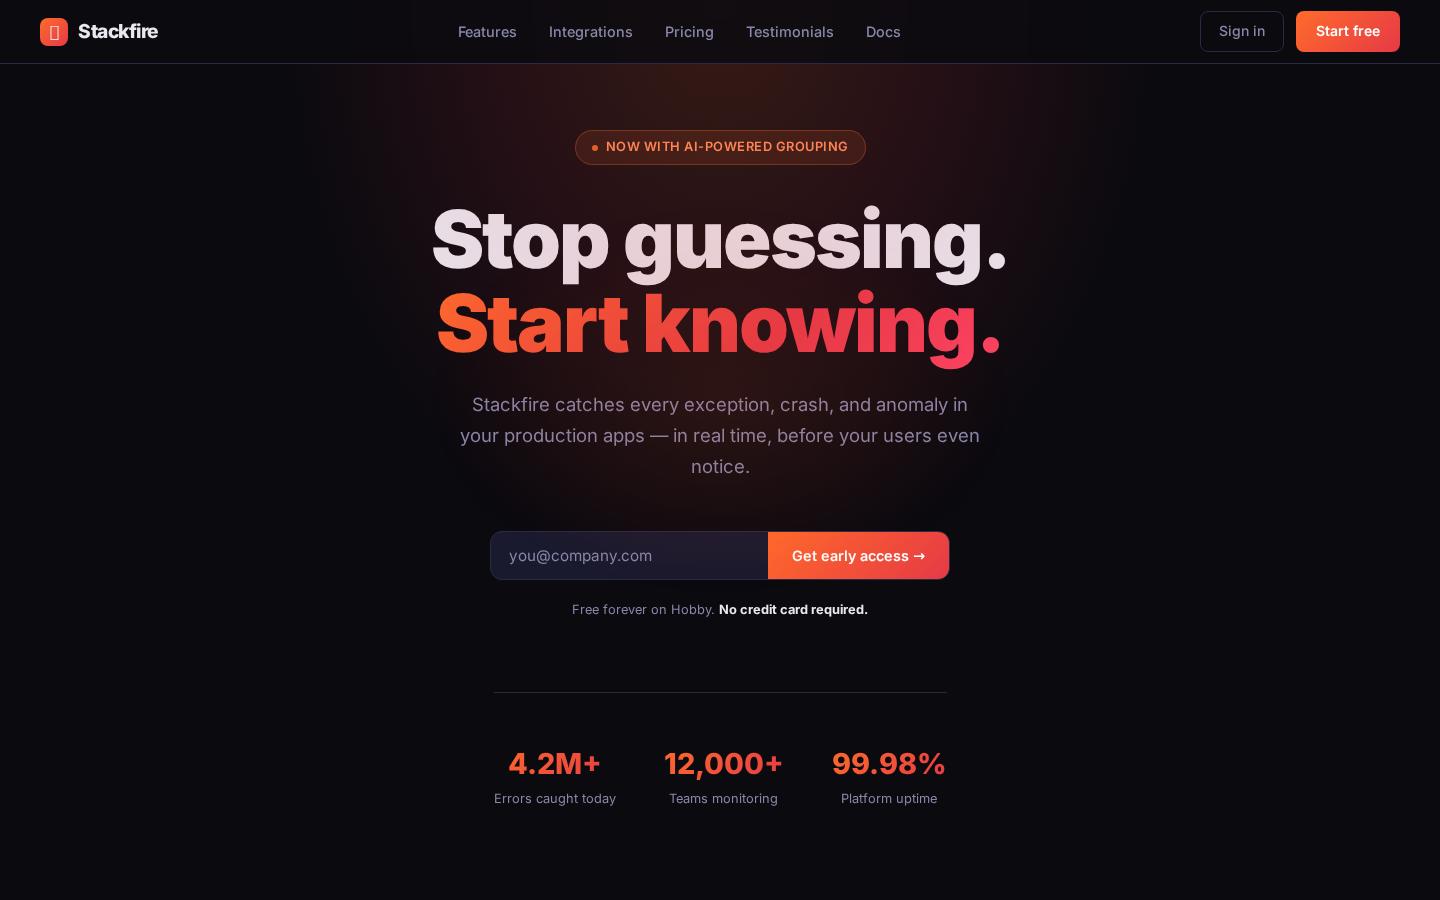
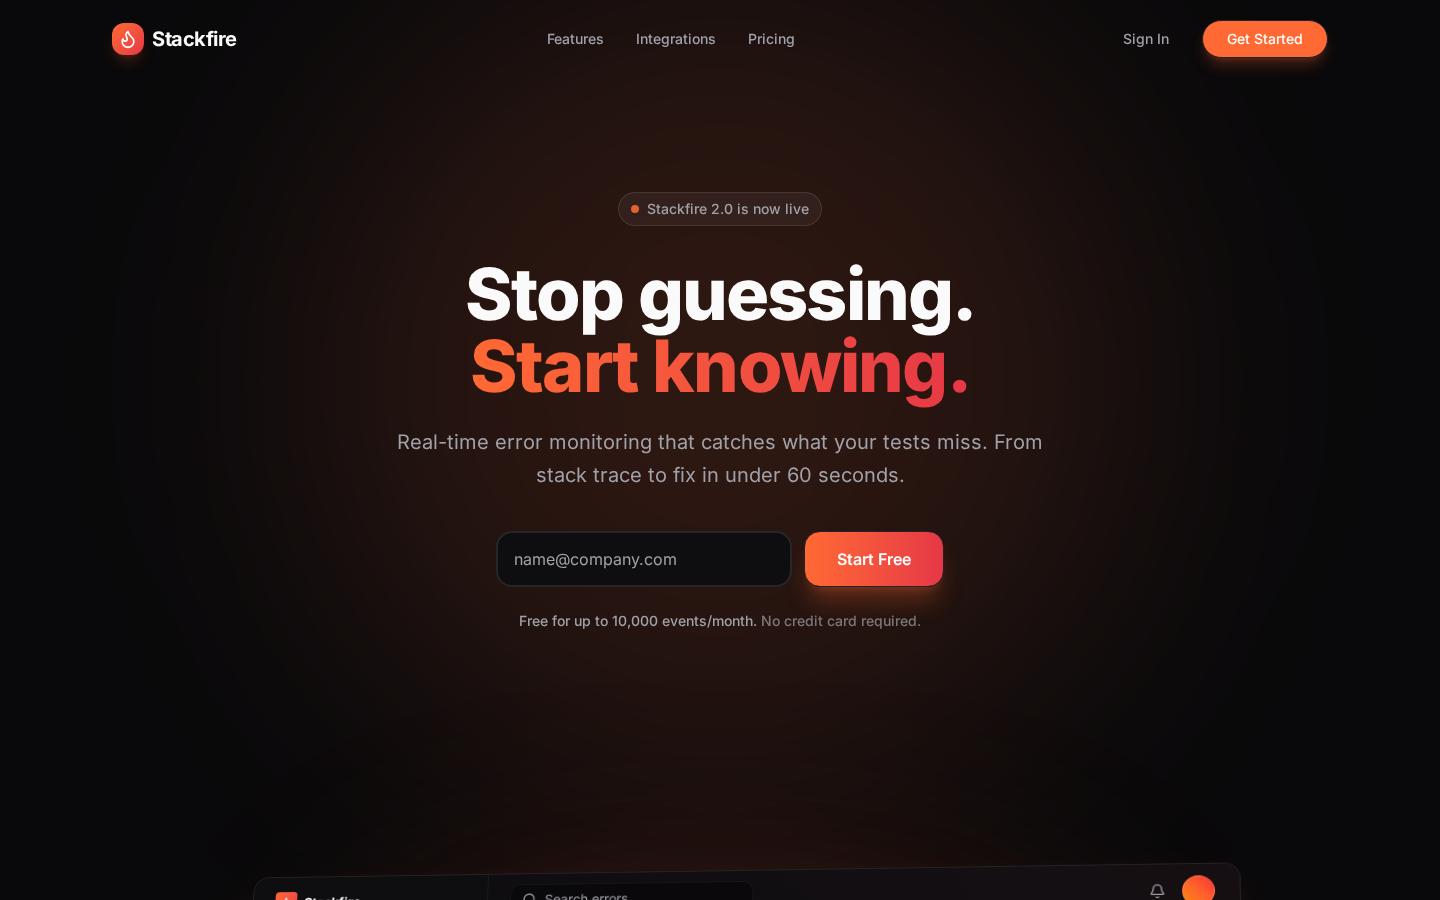
Here's what lopsided verdicts look like. "Stackfire," a SaaS error monitoring tool. Cursor (14 votes) vs Replit (1 vote):
| Cursor: 14 votes | Replit: 1 vote |
|---|---|
 |
 |
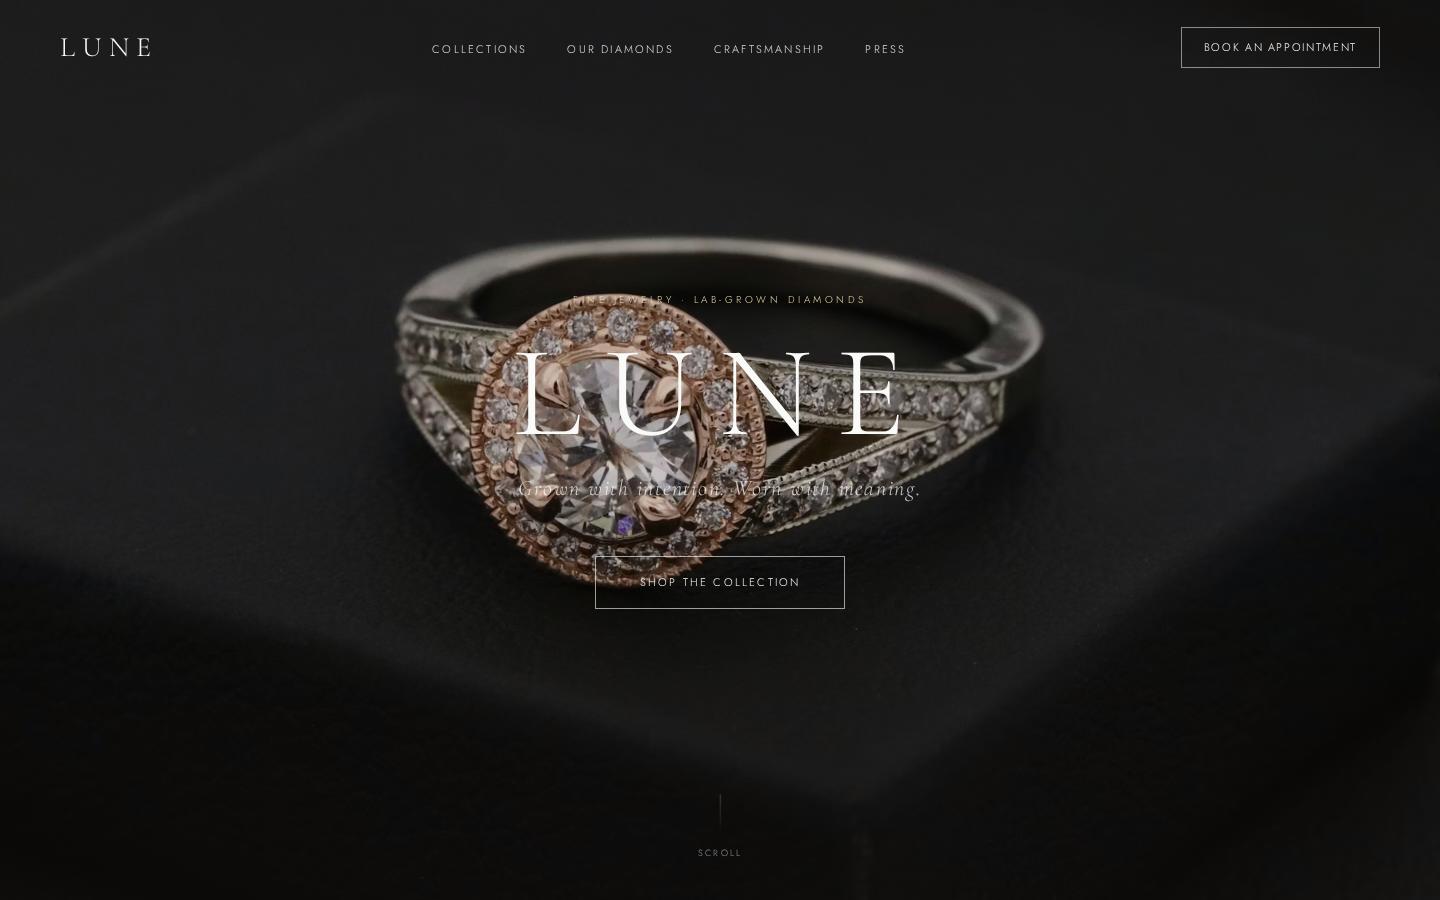
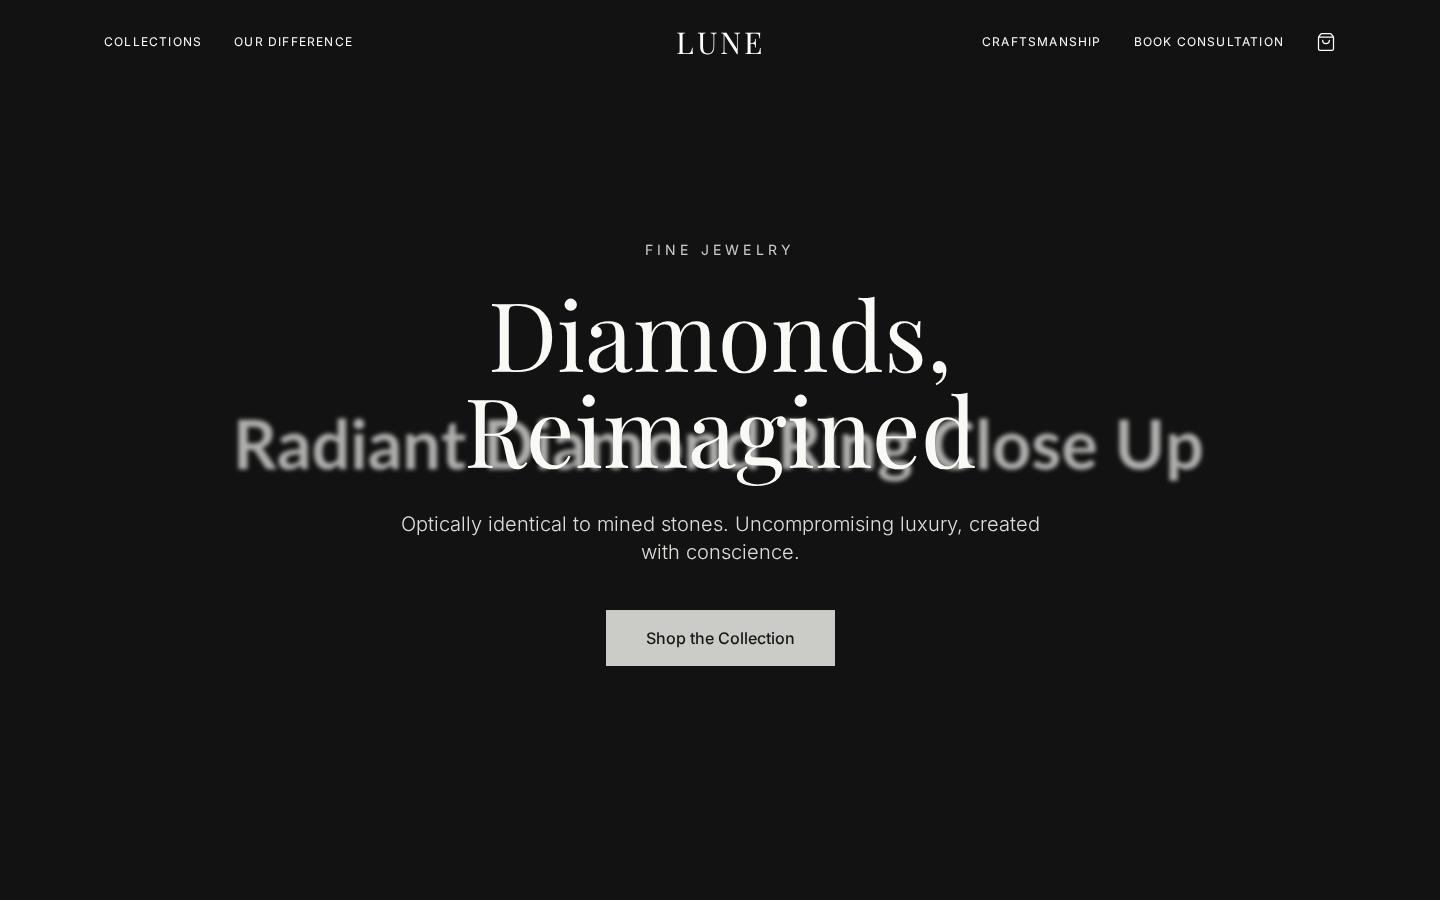
And "Lune," a fine jewelry brand. Cursor (14 votes) vs Replit (1 vote):
| Cursor: 14 votes | Replit: 1 vote |
|---|---|
 |
 |
The Rankings
Bradley-Terry model rankings convert pairwise human preferences into a global strength score. Higher = more preferred. 95% confidence intervals computed via 1,000 bootstrap iterations.
| Rank | Tool | Strength | 95% CI |
|---|---|---|---|
| 1 | Cursor | 0.271 | 0.265 - 0.277 |
| 2 | Claude | 0.269 | 0.263 - 0.274 |
| 3 | Lovable | 0.262 | 0.256 - 0.267 |
| 4 | Replit | 0.199 | 0.194 - 0.204 |
Cursor takes the top spot. Claude is close behind. Lovable is third. Replit is significantly behind the pack (p < 0.001). The margins between the top three are tight (Cursor vs Claude is nearly a coin flip), but the ordering holds across every analysis variant we ran, including Bayesian hierarchical Bradley-Terry with annotator reliability modeling.
Same Prompt, Four Tools
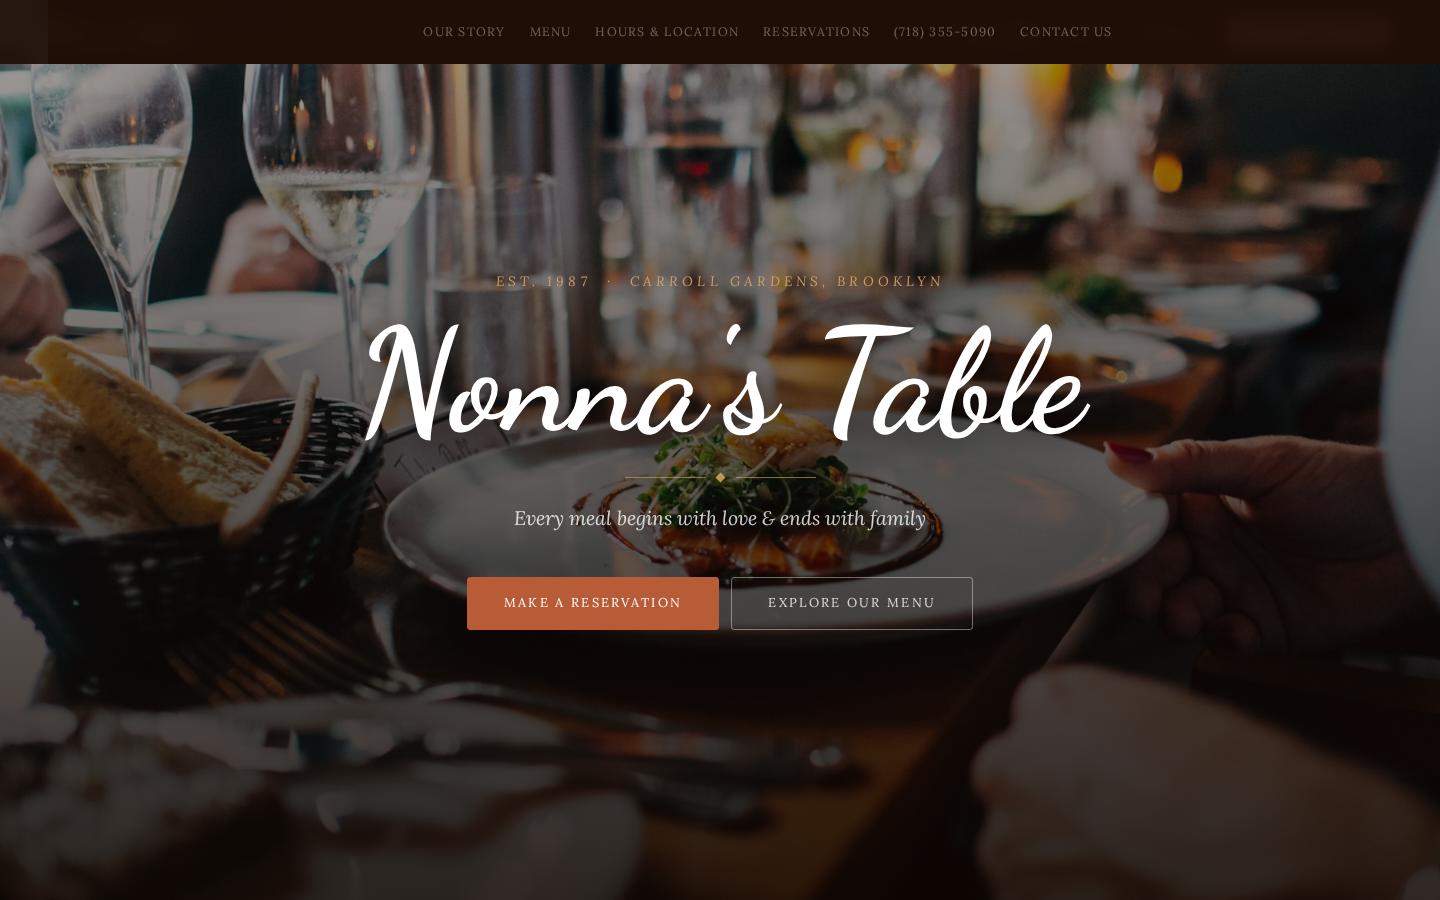
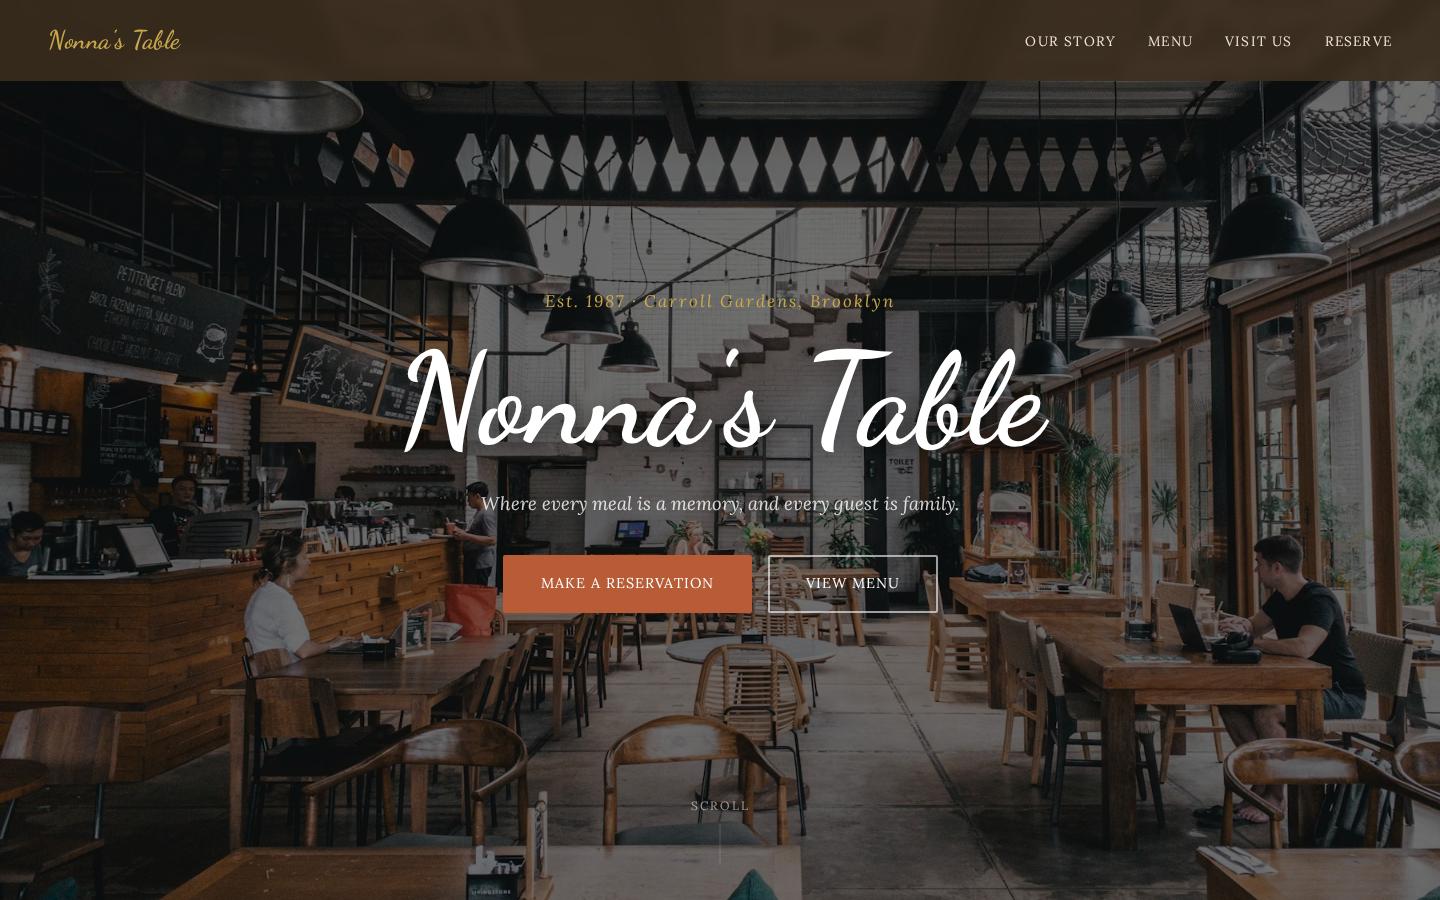
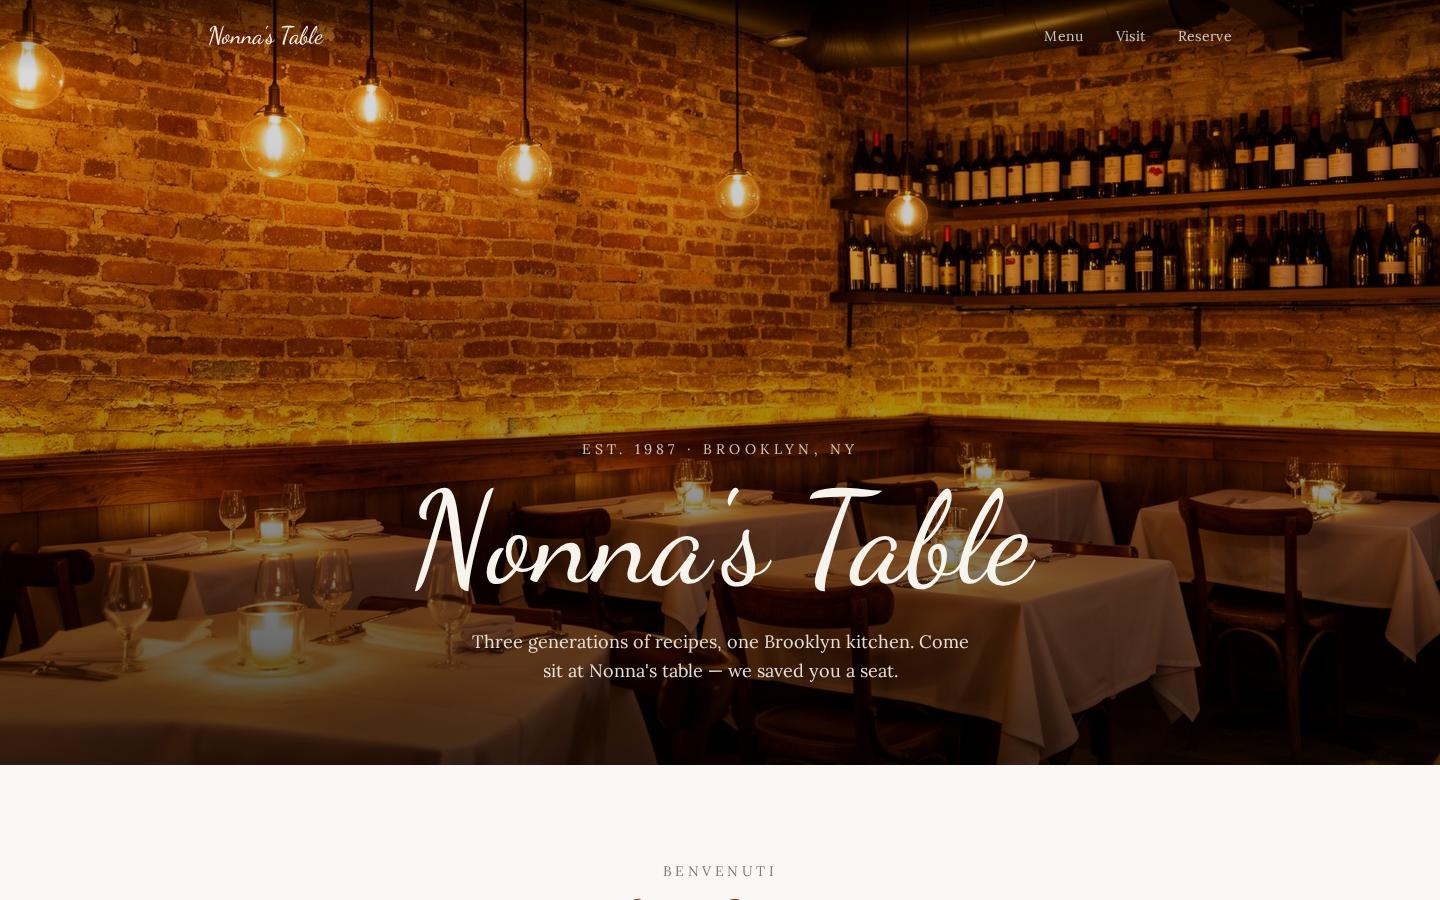
Here's what the ranking looks like in practice. All four tools received the same prompt, and each participates in 12 matchups (3 opponents x 4 dimensions):
Build a landing page for 'Nonna's Table' — a family-owned Italian restaurant in Brooklyn. Hero with a full-width photo of the dining room and the restaurant name in a handwritten-style font, a short welcome paragraph, a two-column menu section (antipasti/primi/secondi/dolci) with prices, an embedded Google Maps placeholder, hours of operation, a reservation form with date/time/party-size fields, and a footer with social links. Warm earthy tones, off-white background, Lora body text.
| Claude: 9/12 wins (75%) | Cursor: 8/12 wins (67%) |
|---|---|
 |
 |
| Lovable: 7/12 wins (58%) | Replit: 0/12 wins (0%) |
 |
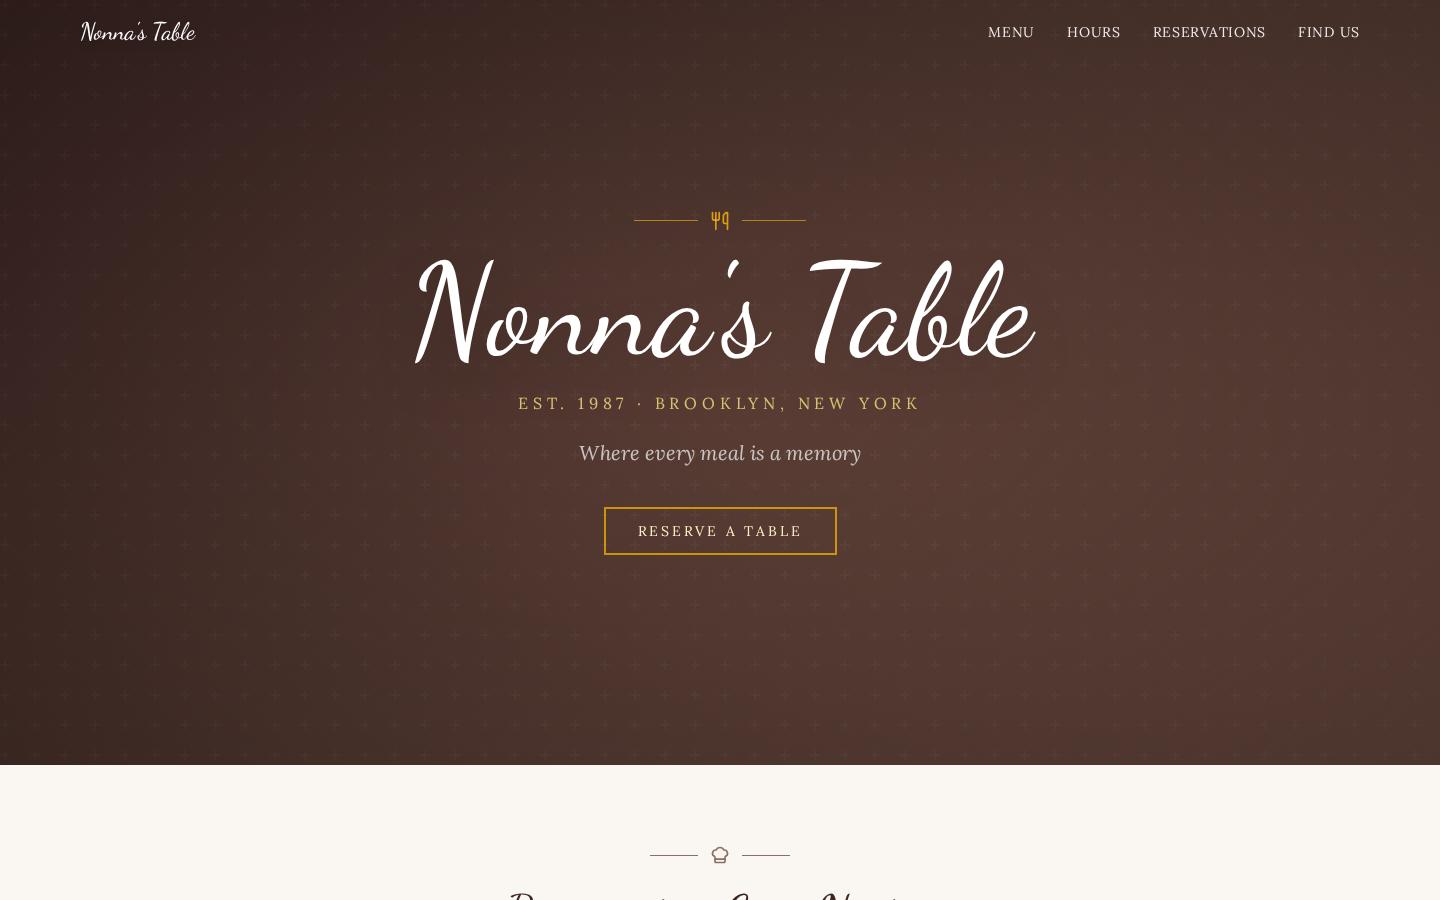 |
Claude and Cursor both produce rich, image-driven heroes with complete page structure. Lovable delivers atmosphere but with slightly less content. Replit generates a clean layout but with no imagery: a solid brown background where the dining room photo should be.
Majority Vote Win Rate
For each of the 2,400 comparisons (600 datapoints x 4 dimensions), 15 annotators voted. The tool that got the majority of votes wins that comparison.
| Rank | Tool | Wins | Matchups | Win Rate |
|---|---|---|---|---|
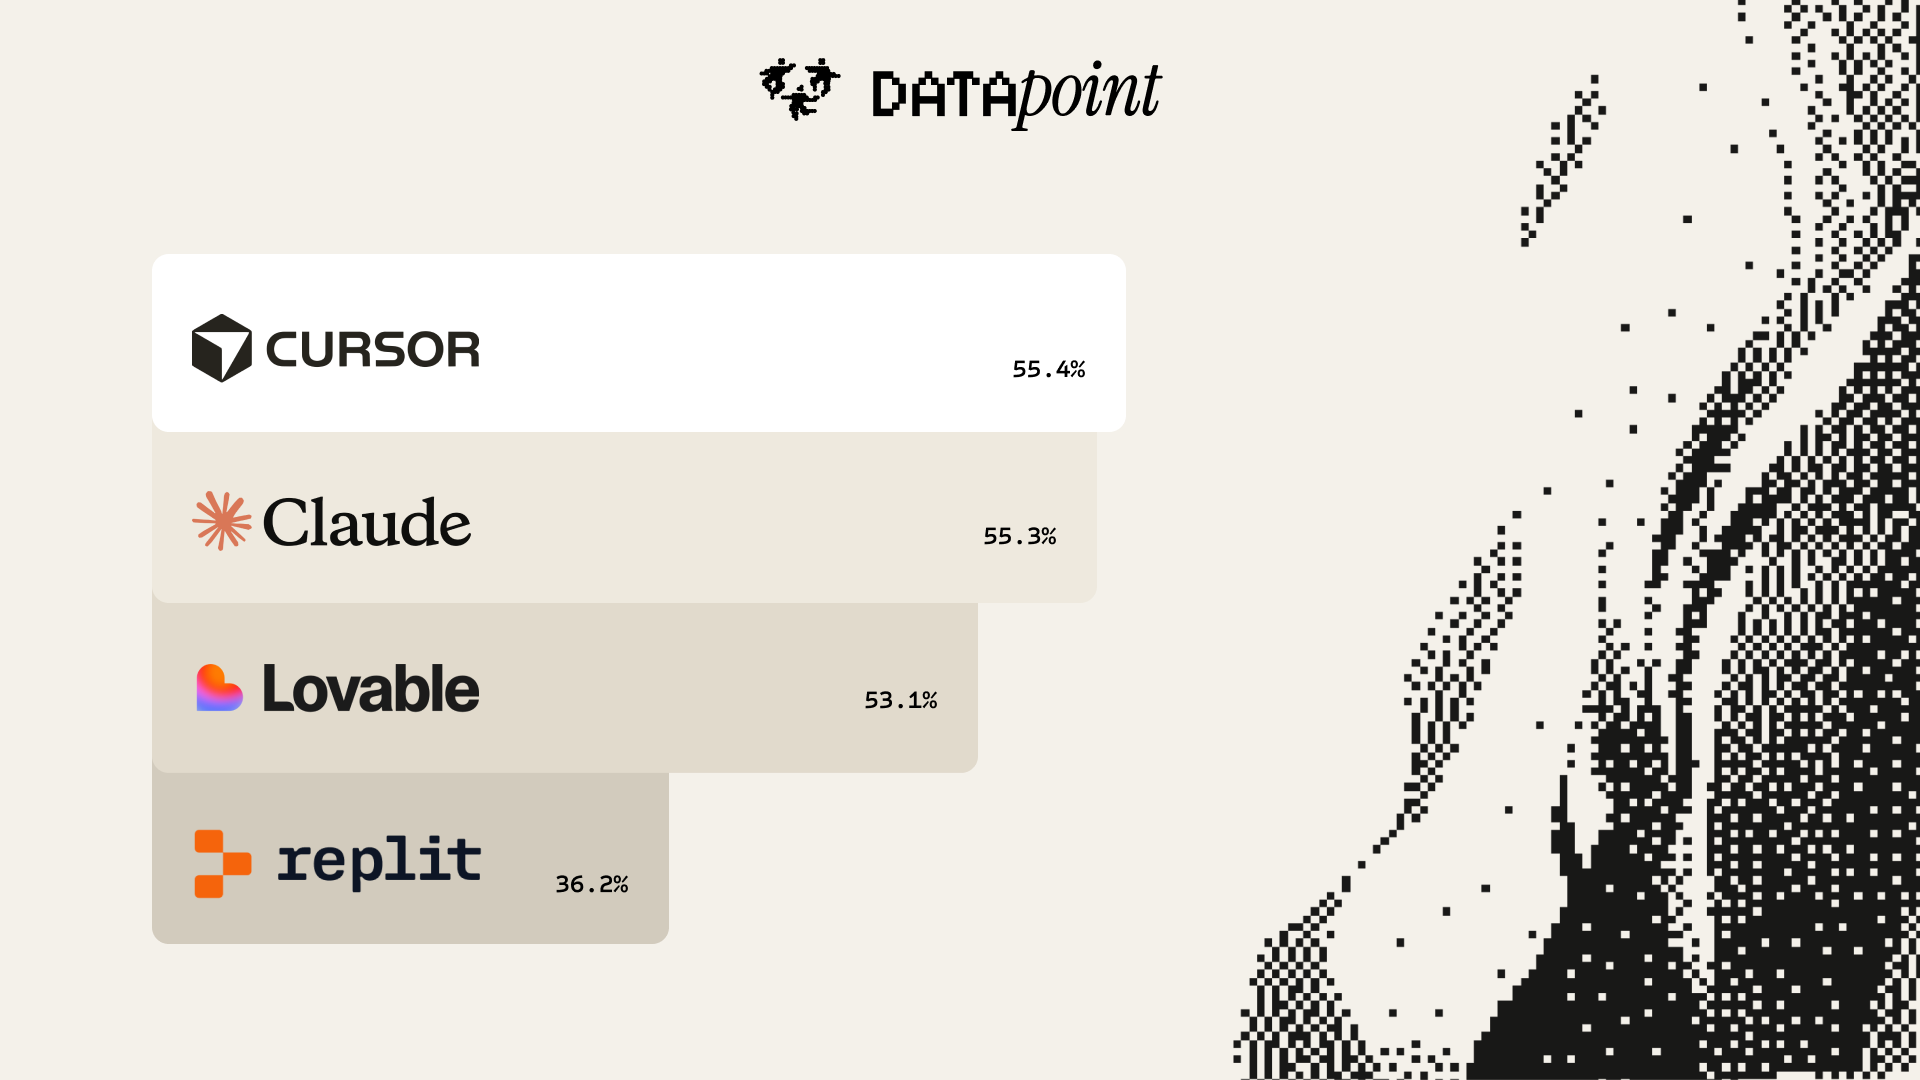
| 1 | Cursor | 665 | 1,200 | 55.4% |
| 2 | Claude | 664 | 1,200 | 55.3% |
| 3 | Lovable | 637 | 1,200 | 53.1% |
| 4 | Replit | 434 | 1,200 | 36.2% |
Replit ranking last is consistent with the independent UI-Bench study (4,075 expert judgments, 10 tools), where Replit also placed last. The convergence across two independent evaluations with different methodologies strengthens this finding.
Every Tool Has a Different Superpower
Each evaluator judged four aspects of design quality independently:
| Dimension | Question | #1 | #2 | #3 | #4 |
|---|---|---|---|---|---|
| Aesthetic | "Which design looks better at first glance?" | Lovable | Cursor | Claude | Replit |
| Typography | "Which has better font choices, sizing, and readability?" | Cursor | Claude | Lovable | Replit |
| Layout | "Which has better spacing, alignment, and visual flow?" | Lovable | Claude | Cursor | Replit |
| Completeness | "Which has more fully-built sections with no empty or broken areas?" | Claude | Cursor | Lovable | Replit |
No tool wins every dimension. Lovable produces the most visually appealing pages. Cursor has the best typography. Claude builds the most complete pages: every section filled out, nothing half-finished. Replit finishes last in all four.
Majority Vote Win Rate by Dimension
The table above uses Bradley-Terry, which estimates a latent strength from all pairwise outcomes simultaneously. The table below uses majority vote: each matchup is binary (whoever got more of 15 votes wins), then we count total wins. The two methods can disagree on tight margins. For aesthetics, Lovable ranks #1 by BT strength, but Cursor edges it 57.3% to 57.0% in raw majority wins. The difference is not statistically significant.
| Dimension | #1 | #2 | #3 | #4 |
|---|---|---|---|---|
| Aesthetic | Cursor (57.3%) | Lovable (57.0%) | Claude (52.7%) | Replit (33.0%) |
| Typography | Cursor (57.7%) | Claude (57.0%) | Lovable (48.0%) | Replit (37.3%) |
| Layout | Lovable (56.3%) | Claude (56.0%) | Cursor (50.3%) | Replit (37.3%) |
| Completeness | Cursor (56.3%) | Claude (55.7%) | Lovable (51.0%) | Replit (37.0%) |
This dimension-level breakdown is something prior studies lack. Verita AI's study used four evaluation categories but had only 5 annotators and 1,260 votes. UI-Bench used a single holistic question with 194 expert evaluators. Our 36,000 judgments across four independent dimensions let us see not just which tool wins overall, but where each tool's design output actually breaks down.
Head-to-Head
Direct win rates from all pairwise matchups. Rows beat columns at the listed rate.
| Claude | Cursor | Lovable | Replit | |
|---|---|---|---|---|
| Claude | -- | 50.7% | 49.5% | 57.8% |
| Cursor | 49.3% | -- | 50.5% | 58.8% |
| Lovable | 50.5% | 49.5% | -- | 55.2% |
| Replit | 42.2% | 41.2% | 44.8% | -- |
The top three trade wins at near-50% rates against each other. All three beat Replit comfortably. Replit never wins a majority against any tool.
The Right Tool Depends on What You're Building
Bradley-Terry rankings computed per business category. For each of the 97 categories, we ranked the tools by which one evaluators preferred.
| Tool | #1 in categories | Strongest categories |
|---|---|---|
| Lovable | 35 of 97 | ecommerce, fitness, gaming, real estate, skincare, wine, jewelry, dating, biotech |
| Claude | 32 of 97 | fintech, legal, consulting, education, restaurant, travel, cybersecurity, HR tech |
| Cursor | 17 of 97 | SaaS, agency, productivity, recruiting, music education, coworking |
| Replit | 13 of 97 | developer tools, API platform, accounting, compliance, sleep tech |
Lovable dominates consumer and lifestyle categories, anything where visual appeal drives conversion. Claude wins in professional and enterprise categories where thorough, complete page structure matters more than visual flair. Cursor wins in tech and SaaS. Replit's wins cluster around developer-facing tools, where its users likely have higher tolerance for rougher design.
Where Each Tool Loses
When a tool loses a matchup, which dimension was its weakest?
| Tool | Weakest dimension | Loss rate | Strongest dimension | Loss rate |
|---|---|---|---|---|
| Claude | Aesthetic | 48.4% | Completeness | 46.2% |
| Cursor | Layout | 48.4% | Completeness | 46.4% |
| Lovable | Typography | 50.2% | Aesthetic | 46.2% |
| Replit | Aesthetic | 58.3% | Typography | 56.1% |
Claude builds everything but doesn't always make it look exciting. Lovable produces beautiful pages with questionable font choices. Cursor's layouts can feel disorganized. Replit looks worse across the board.
Methodology
- 100 prompts, each specifying a business name, brand description, sections (hero, features, pricing, testimonials, etc.), color palette, typography, and tone. Covering 97 business categories and 82 design tones.
- 4 tools: Claude Code (Sonnet 4.6), Cursor (Sonnet 4.6), Lovable, Replit. Each generated a single-file HTML landing page from the same prompt.
- Screenshots captured at 1440x900 viewport via Playwright.
- Evaluation on Datapoint: all C(4,2) = 6 tool pairs per prompt served as blinded pairwise image comparisons. 4 dimensions judged independently per comparison. Display order randomized per serving. 15 independent judgments per matchup per dimension.
- Ranking: Bradley-Terry model with 1,000 bootstrap iterations. Results validated with Bayesian hierarchical BT that jointly models annotator reliability. Ranking unchanged.
- Position bias: Verified negligible (BT with position parameter: delta = -0.03, CI crosses zero).
- Annotator quality: 60% of calibrated annotators achieved perfect trust scores (1.0) on gold-standard calibration tasks.
How This Compares to Prior Work
| This study | UI-Bench | Verita AI | Vibe Design Arena v1 | |
|---|---|---|---|---|
| Prompts | 100 (controlled) | 30 (controlled) | 80 (controlled) | 60 (real-world apps) |
| Tools | 4 | 10 | 4 | 6 |
| Evaluation dimensions | 4 | 1 | 4 | 1 |
| Total judgments | 36,000 | 4,075 | 1,260 | ~53,000 |
| Evaluators | 3,492 crowd | 194 experts | 5 experts | crowd |
| Judgments per matchup | 15 per dimension | ~4 | ~3 | 30 |
| Statistical model | Bradley-Terry + Bayesian BT | TrueSkill | Bradley-Terry | Win rate |
| Position randomization | Yes | Yes | Not reported | Yes |
| Category-level analysis | 97 categories | No | 2 tones | No |
The Data Is Open
The full dataset (2,400 aggregated comparisons with screenshots, prompts, vote counts, and dimension questions) is available at datapointai/vibe-landing-page-arena on HuggingFace under CC-BY-4.0.
Built with Datapoint. Questions: sales@trydatapoint.com.
Run your own side-by-side studies: pairwise comparison data collection via the Datapoint API.